
Our Partners


SCIAD HEALTH™ creates transparency with ease,
on demand!
Simply upload a routine data report and the software converts raw data into actionable analytics without the need for software experts or consultants saving time and staff resources.
Model financial impact of proposals with AI-driven insights and access to competitor transparency data with calculable ROI.
VERIFY
payer plans that are paying identically and the contracting approach for each of your payer fee schedules. Specifically, identify both how different types of services are reimbursed and the base fee schedule of your payer contracts, as they often vary. This is especially valuable for verification of correct payments or if copies of your payer agreements are not readily available.
Create Transparency.
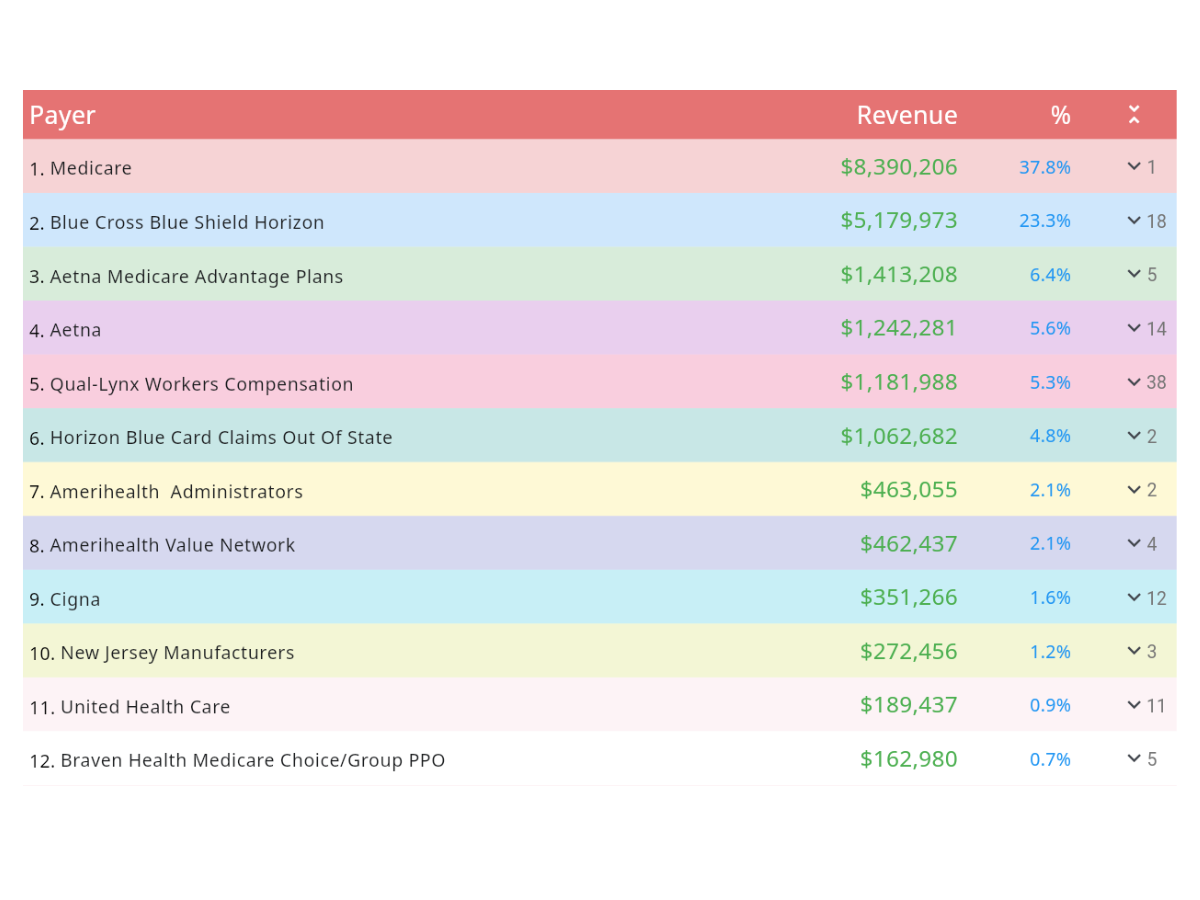
Revenue Mix – Verify which insurance payers are driving your practice revenue.
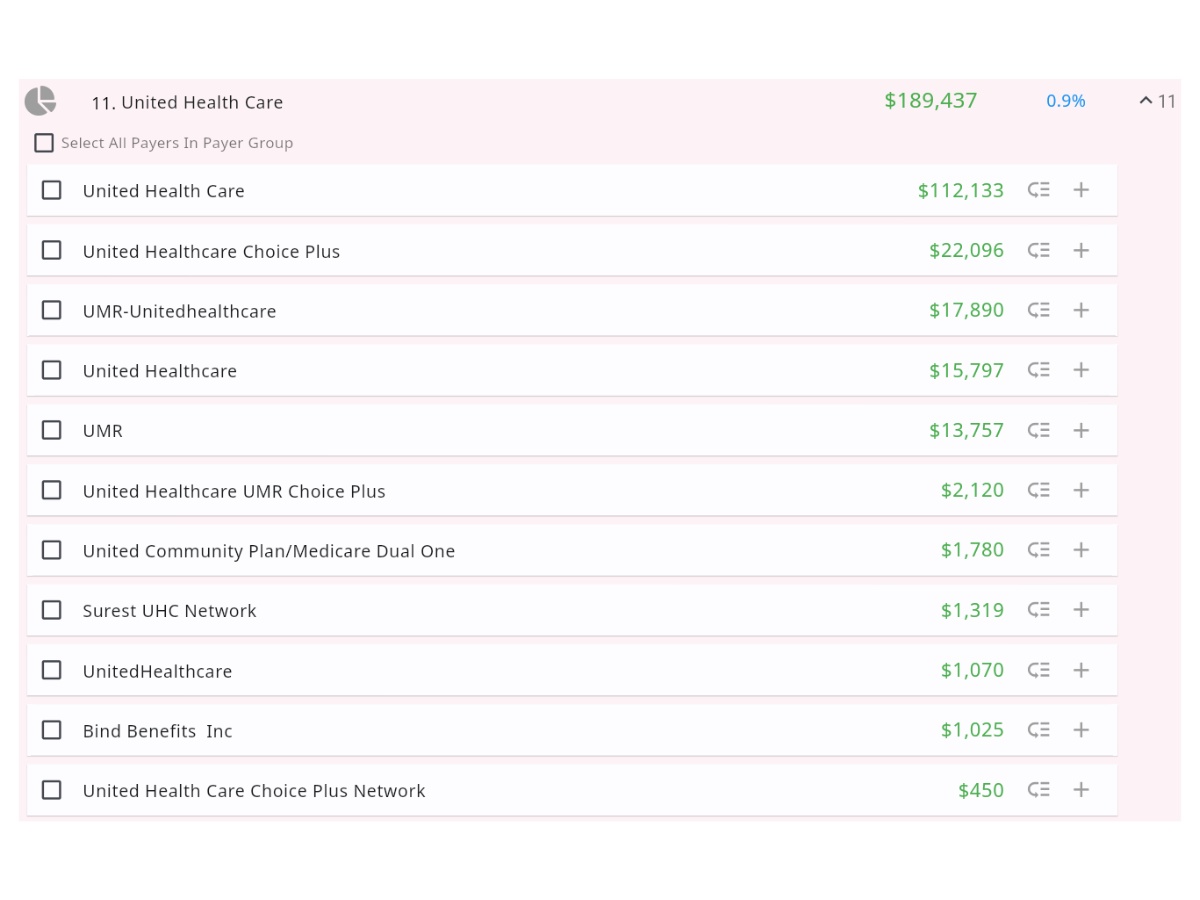
Payer Group – Verify which primary insurance plans are paying identically.
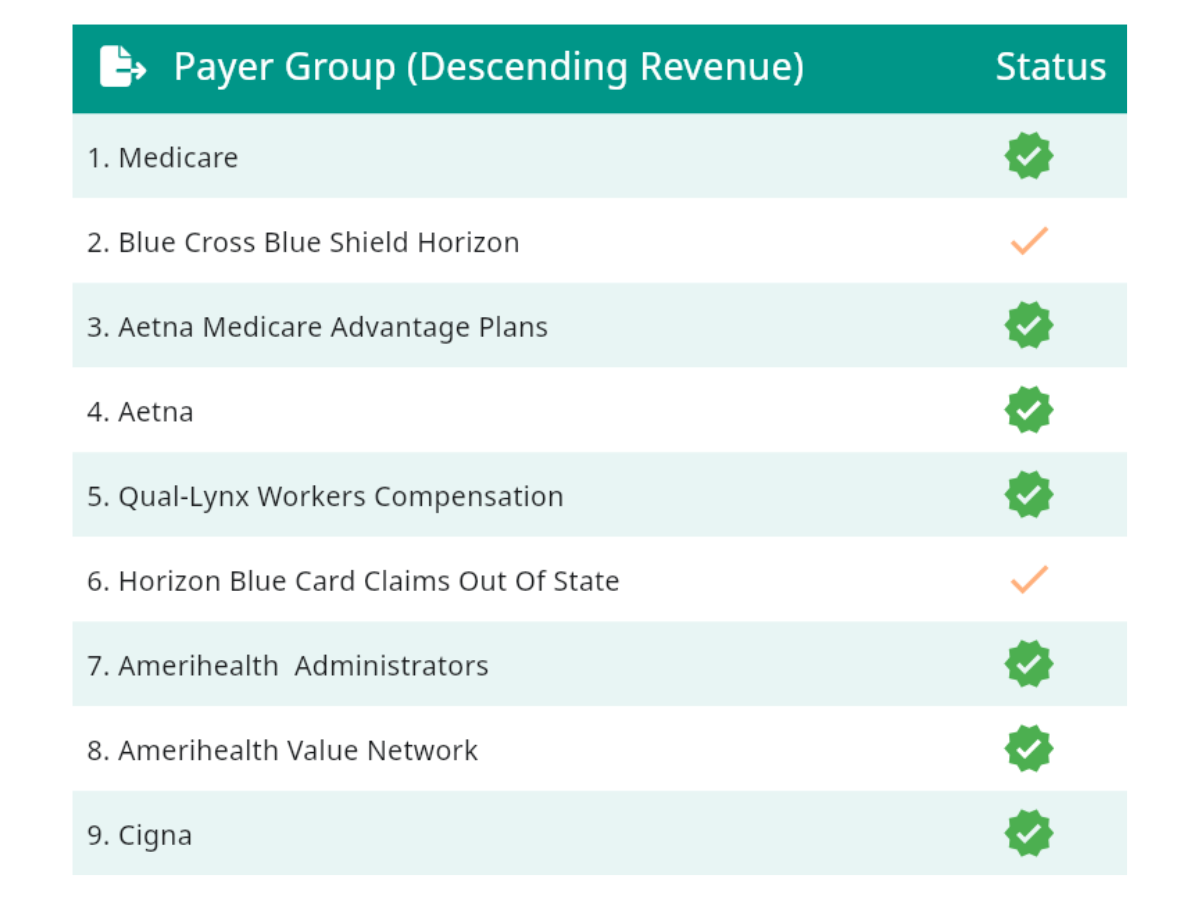
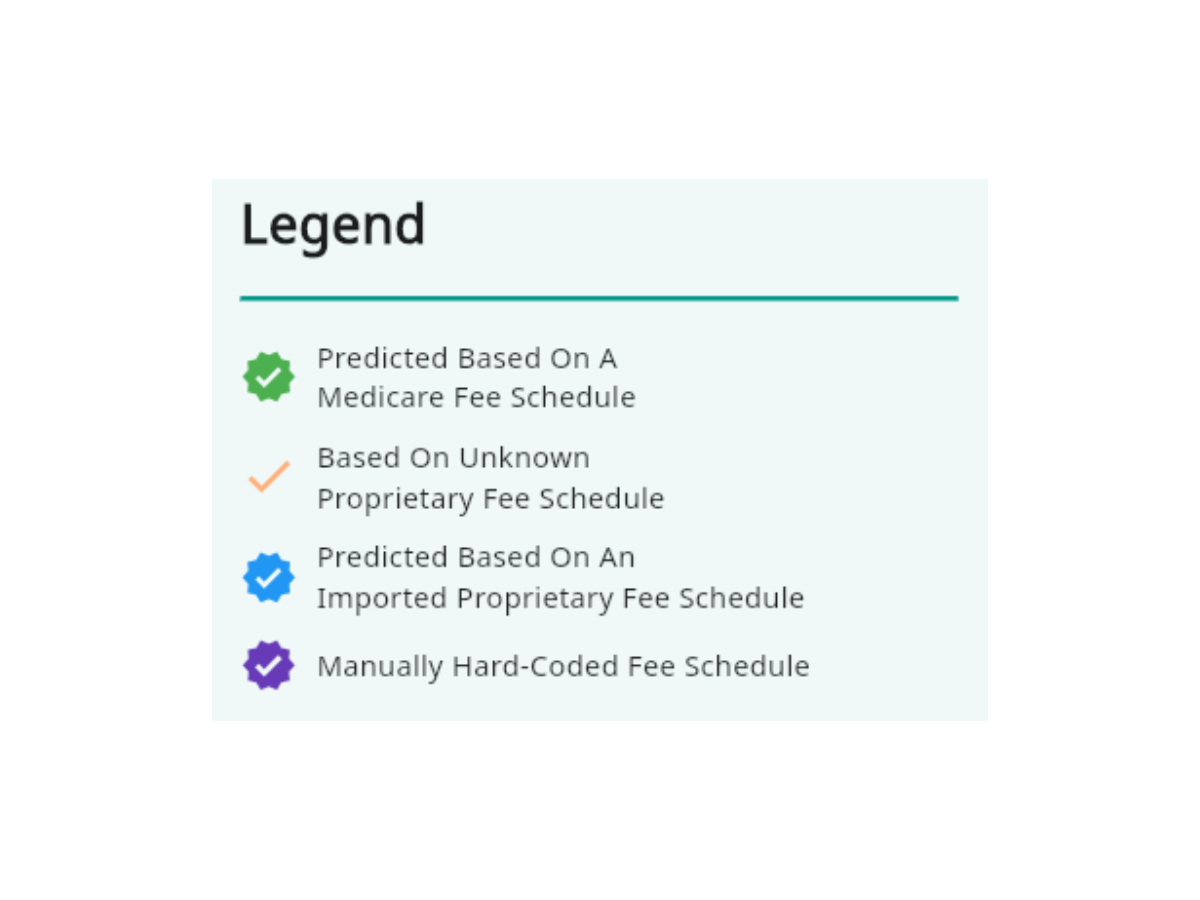
Fee Schedule Discovery – Verify which payer group fee schedules have been quantified
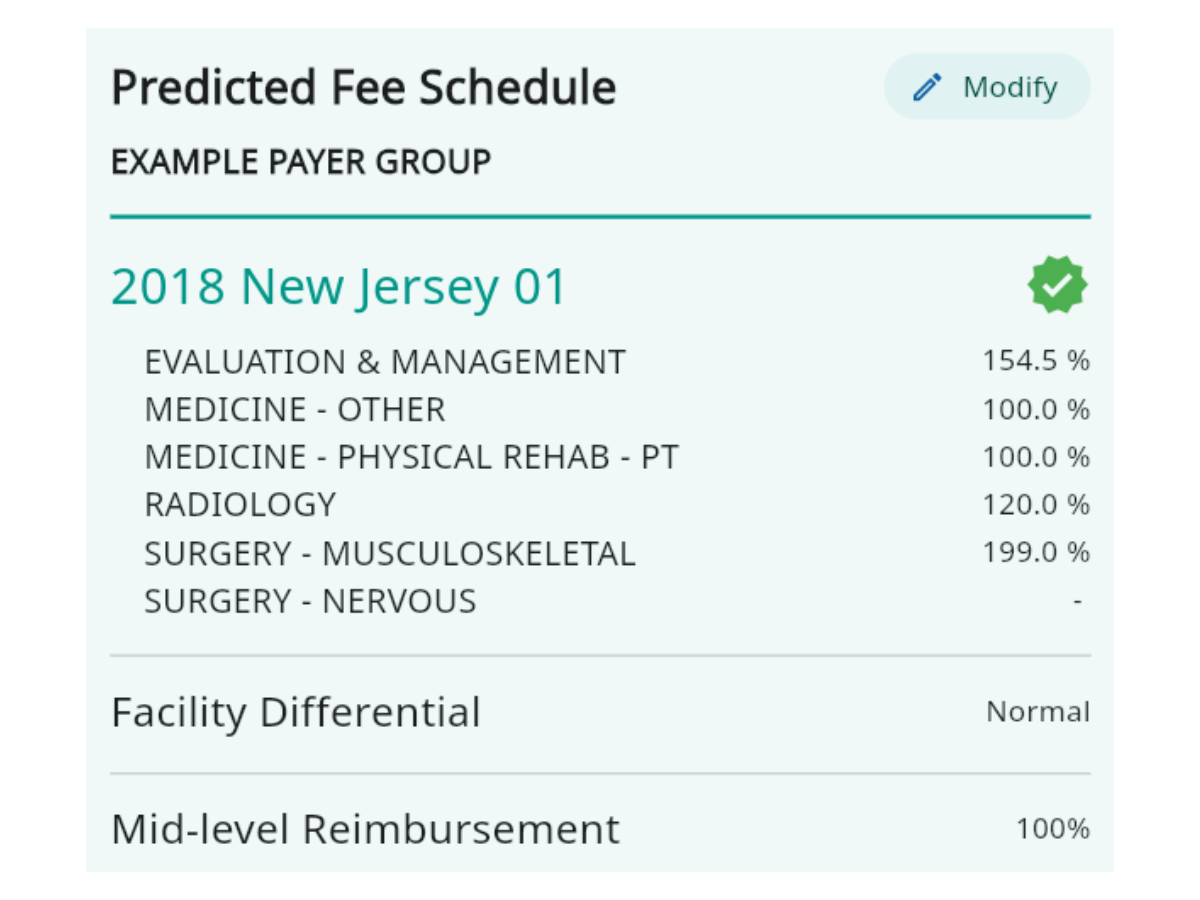
Predicted Fee Schedule – Verify the specific makeup of the predicted contract, including the base year, category markup percentages, and more.
Predictive outcomes within the application.
VALUE
payer agreements against one another for an apple-to-apple comparison. Create breakeven scenarios by level-setting your payer agreements to a contracting base year, including any year/state/locality of Medicare or a proprietary fee schedule. Identify procedure codes that drive revenue and their specific payer allowables.
Gain Insight.
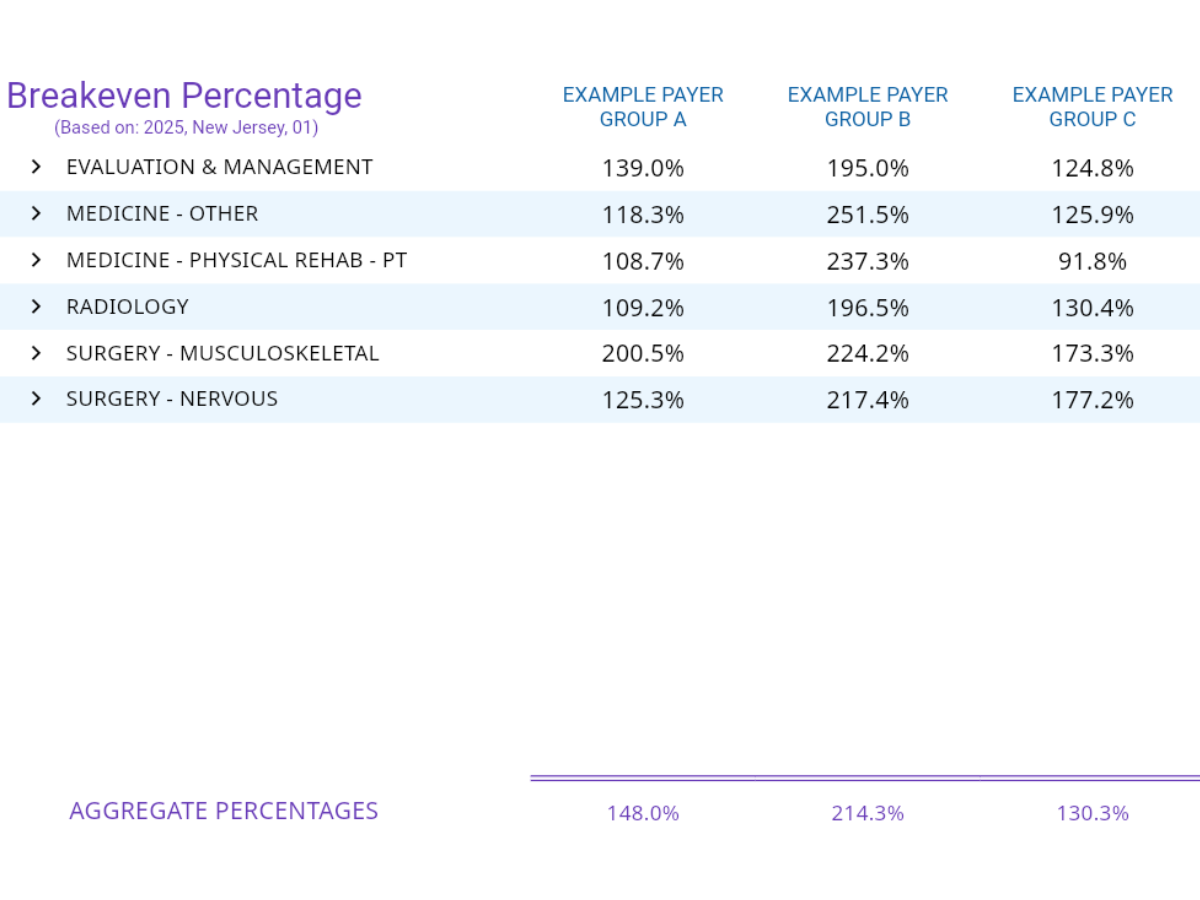
Breakeven Valuation – Value different payer fee schedules side-by-side against a common base fee schedule.
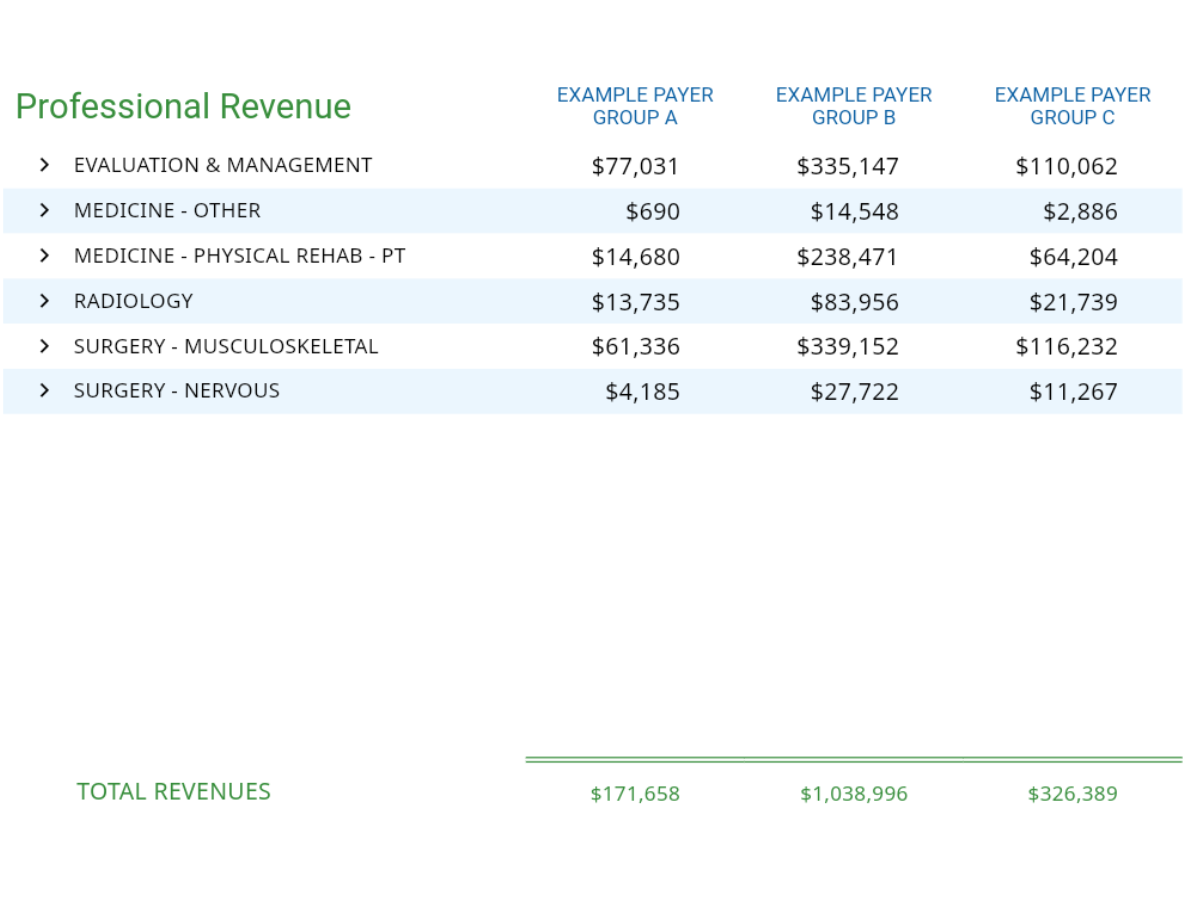
Category Revenue – Value what specific categories are driving your practice’s utilization, down to the dollar.
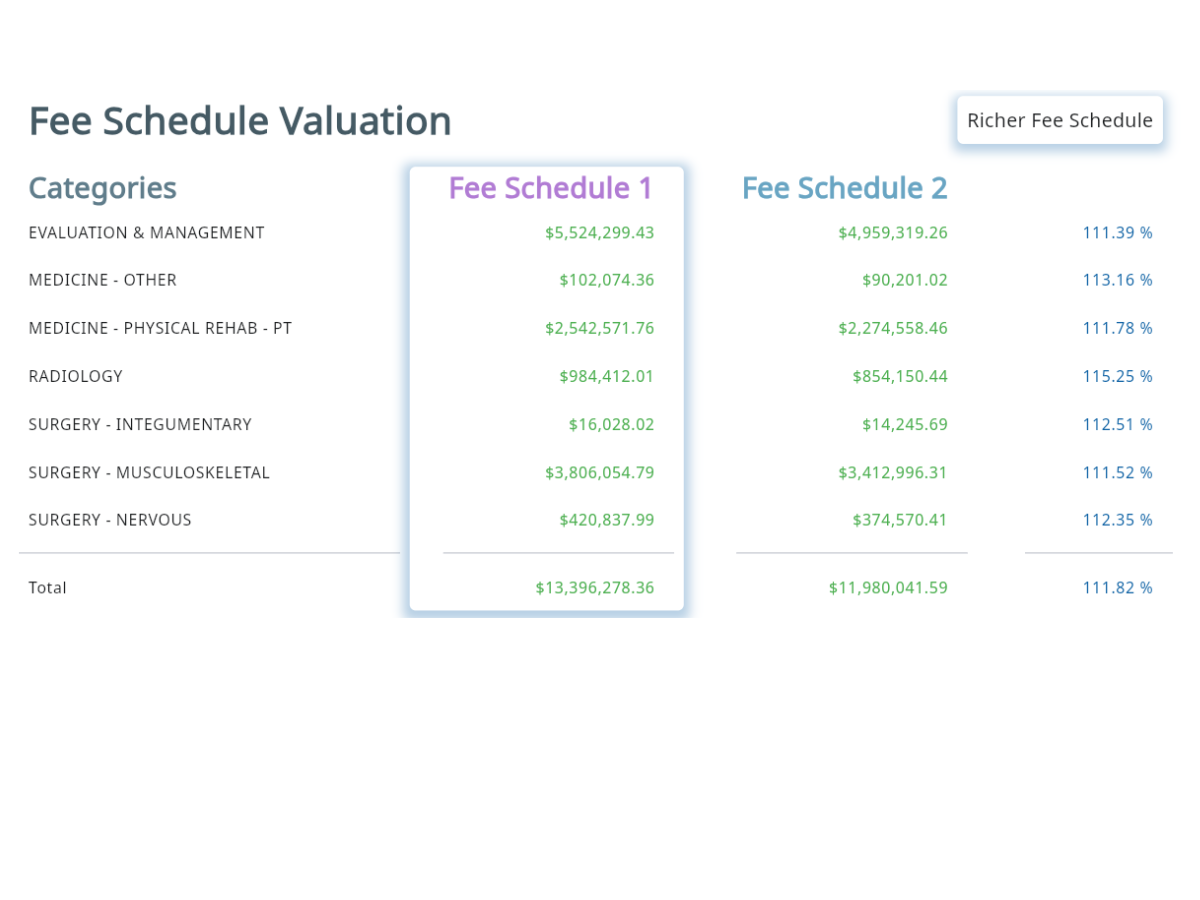
Fee Schedule Valuation – Value two different base fee schedules side-by-side, using your own utilization, to determine which is richer best for contracting.
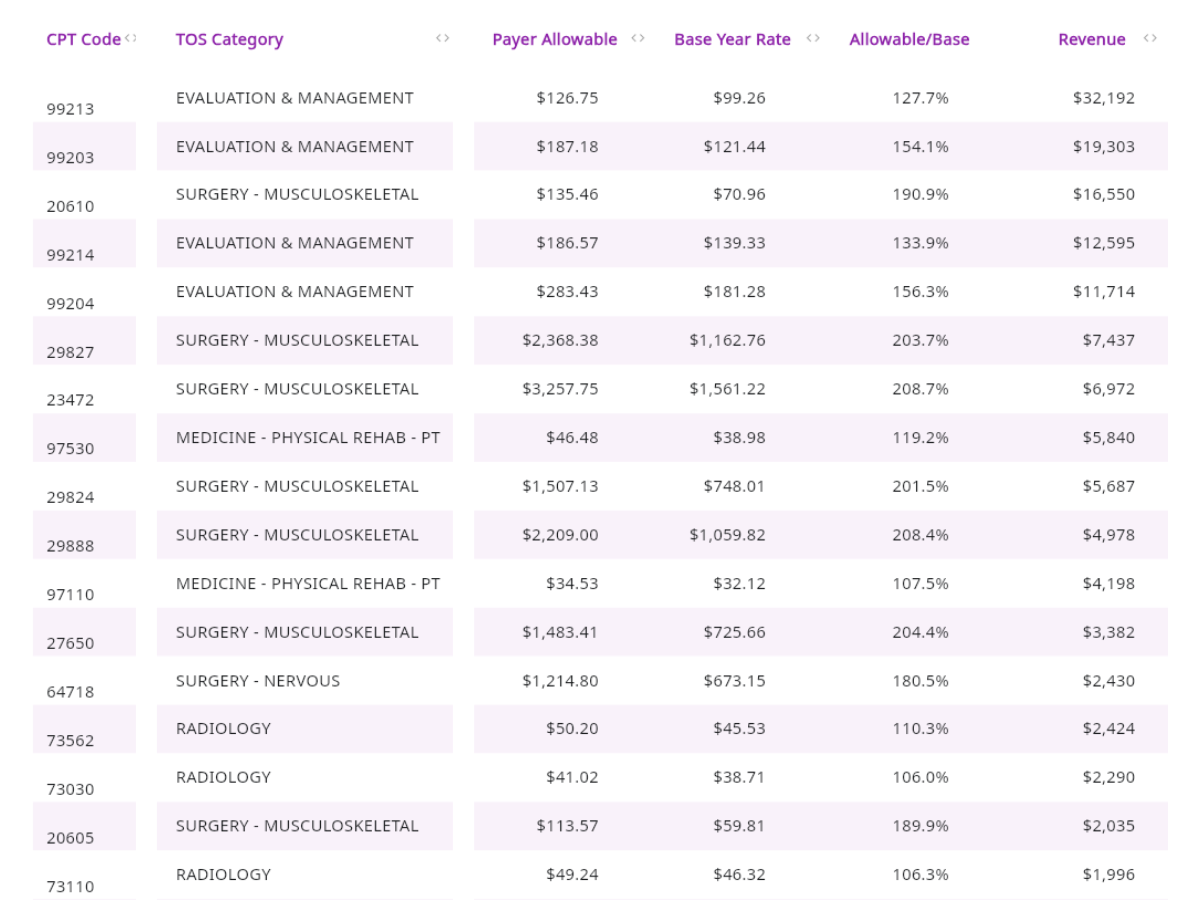
Top CPT Codes – Value, by payer, which CPT codes are driving your practice’s revenue and each code’s contractual allowable.
MODEL
Financial impacts tied to payer proposals using your own practice utilization. This allows for total and complete flexibility with respect to contract negotiations, including adjustments to:
– Category markup percentage
– Contract base fee schedule
– Midlevel provider reduction
– Site of service differential
– Carveouts
See the financial impact by Type of Service category, CPT Code, Provider, and on the aggregate for transparency from all angles.
Level the Playing Field.
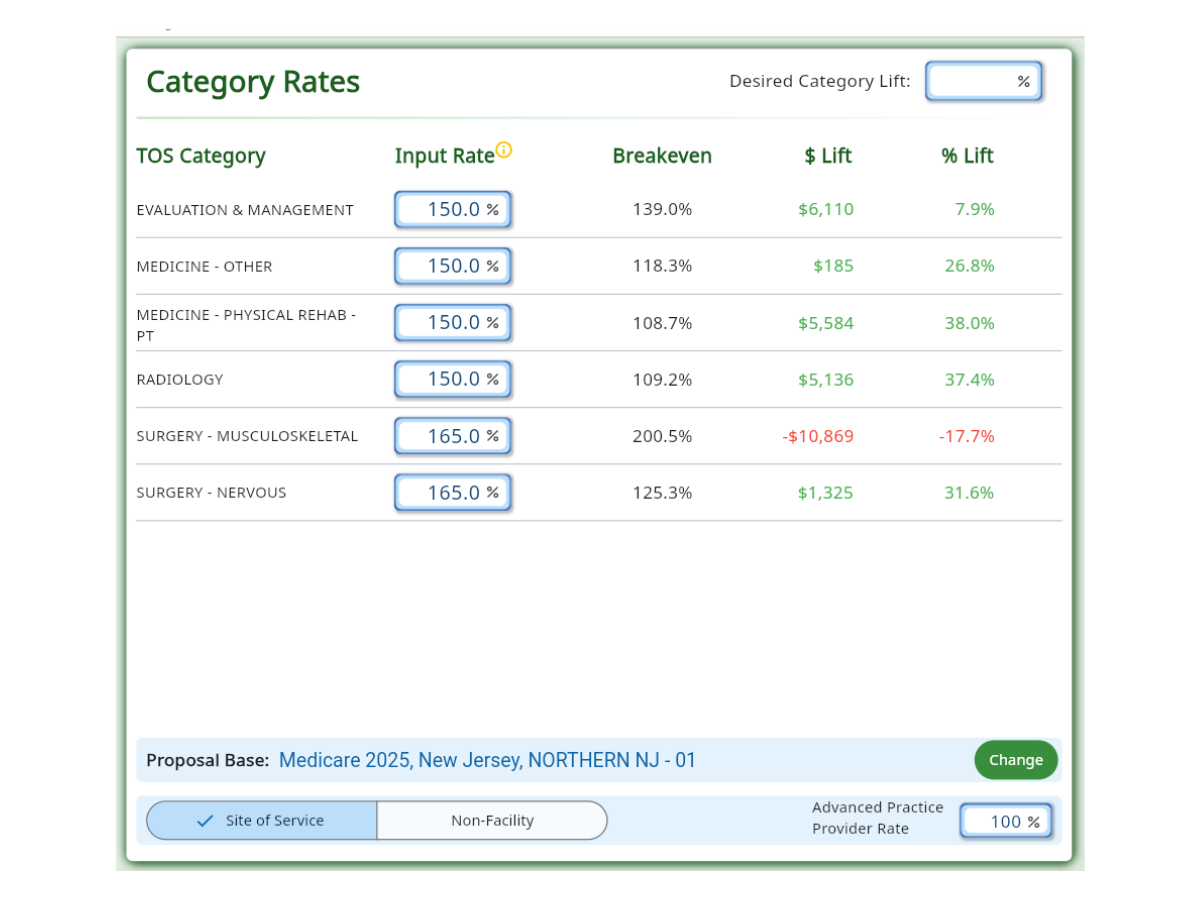
Proposal Inputs – Model markup percentages, base fee schedules, midlevel provider reduction, and site of service differential and more.
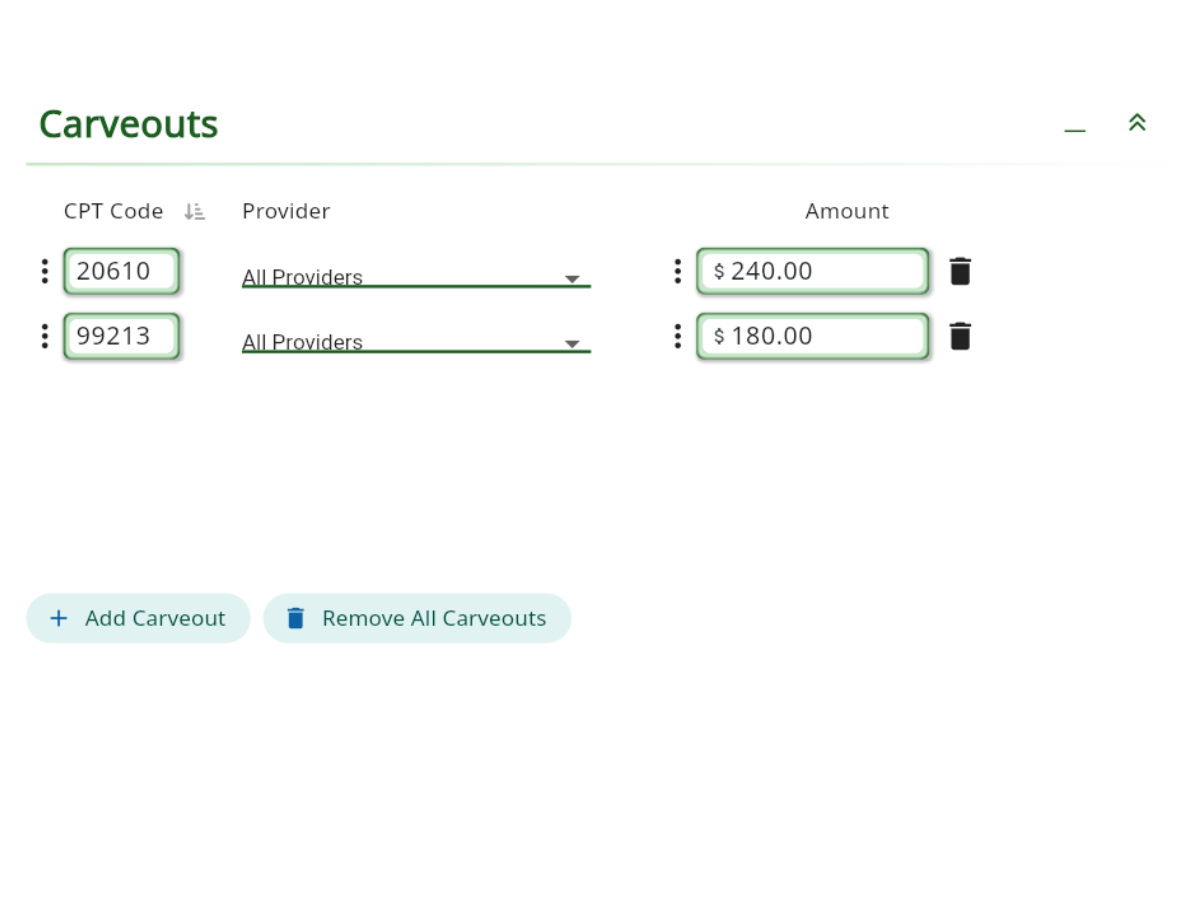
Carveouts – Model individual CPT Code carveouts as flat rates or percentages of the base fee schedule.
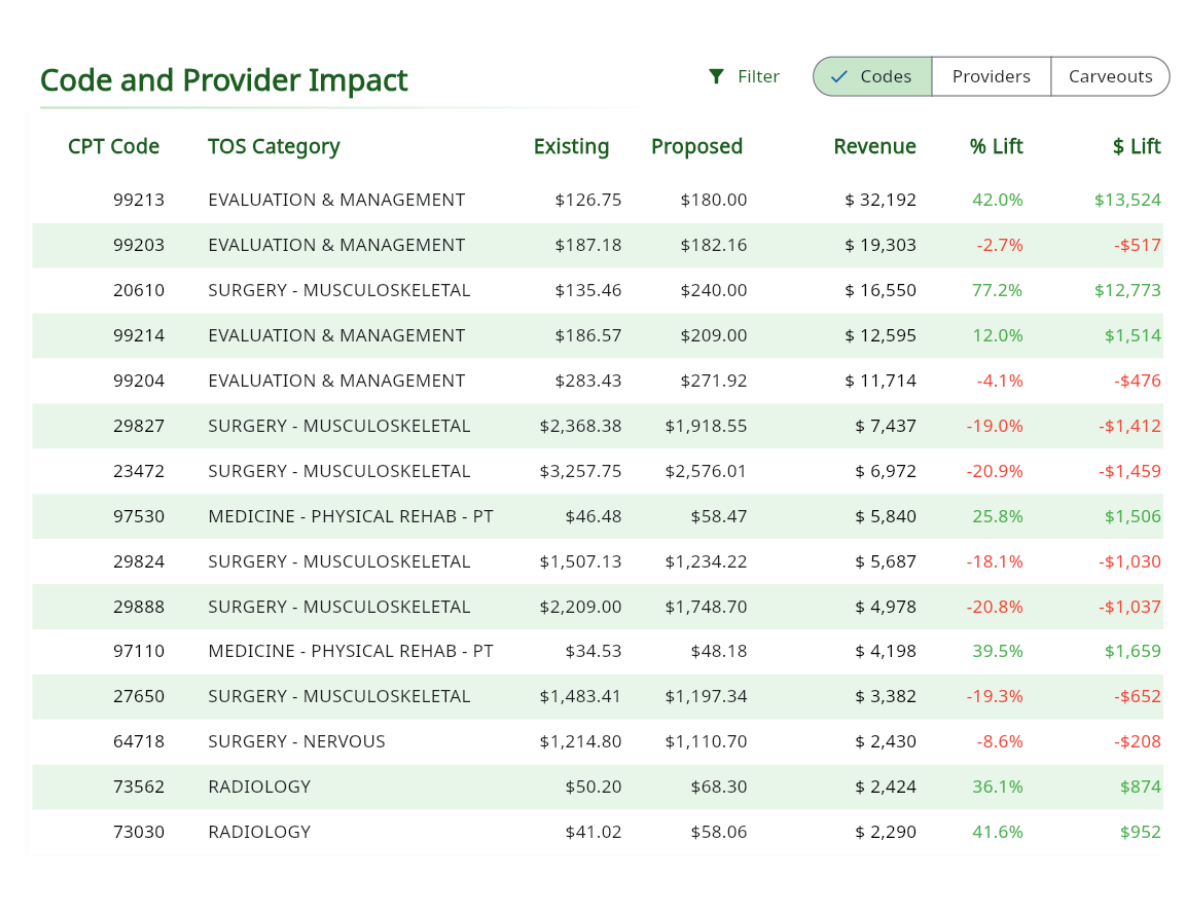
Financial Impact by CPT Code – Model individual codes to see how your gains and losses are driven.
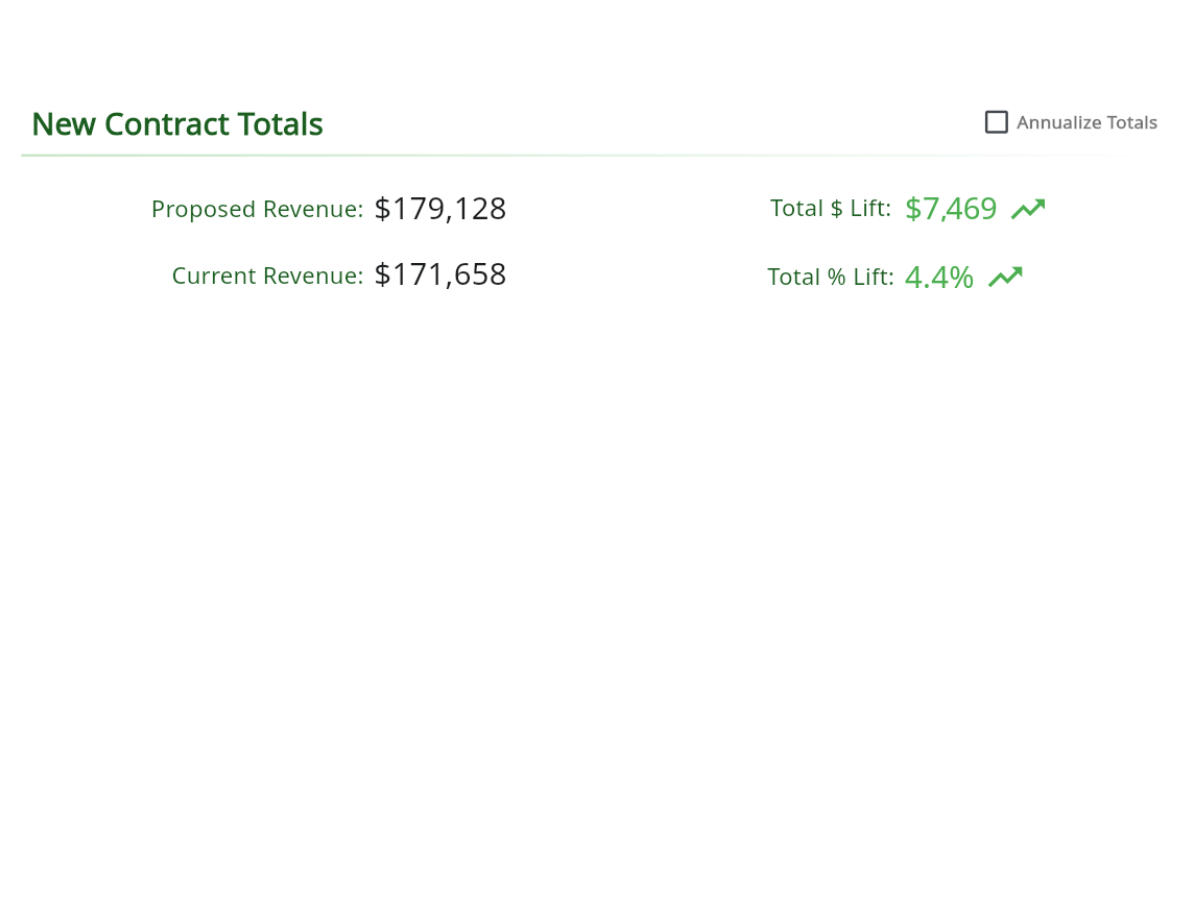
Financial Impact Aggregate – Model the total net financial change as a result of a payer proposal.
About Us
The SCIAD HEALTH™️ team, comprised of highly specialized healthcare executives with practice development and management expertise, accountants, data analysts, and payor contracting specialists, developed this black box technology in support of payer contracting efforts undertaken as providers collaborate to create geographically dominant physician group practices. If there is a desire to fortify your market position as a physician-owned and managed practice, visit jpm-healthcare.com to learn more about the physician aggregation services that gave birth to this exciting technology.